Satta Matka charts are structured records that display daily market results in a clear and organized format. These charts help users understand past results, identify number movement and study market patterns over time.
For live updates and daily charts you can visit the Satta Matka result homepage where market results are updated regularly.
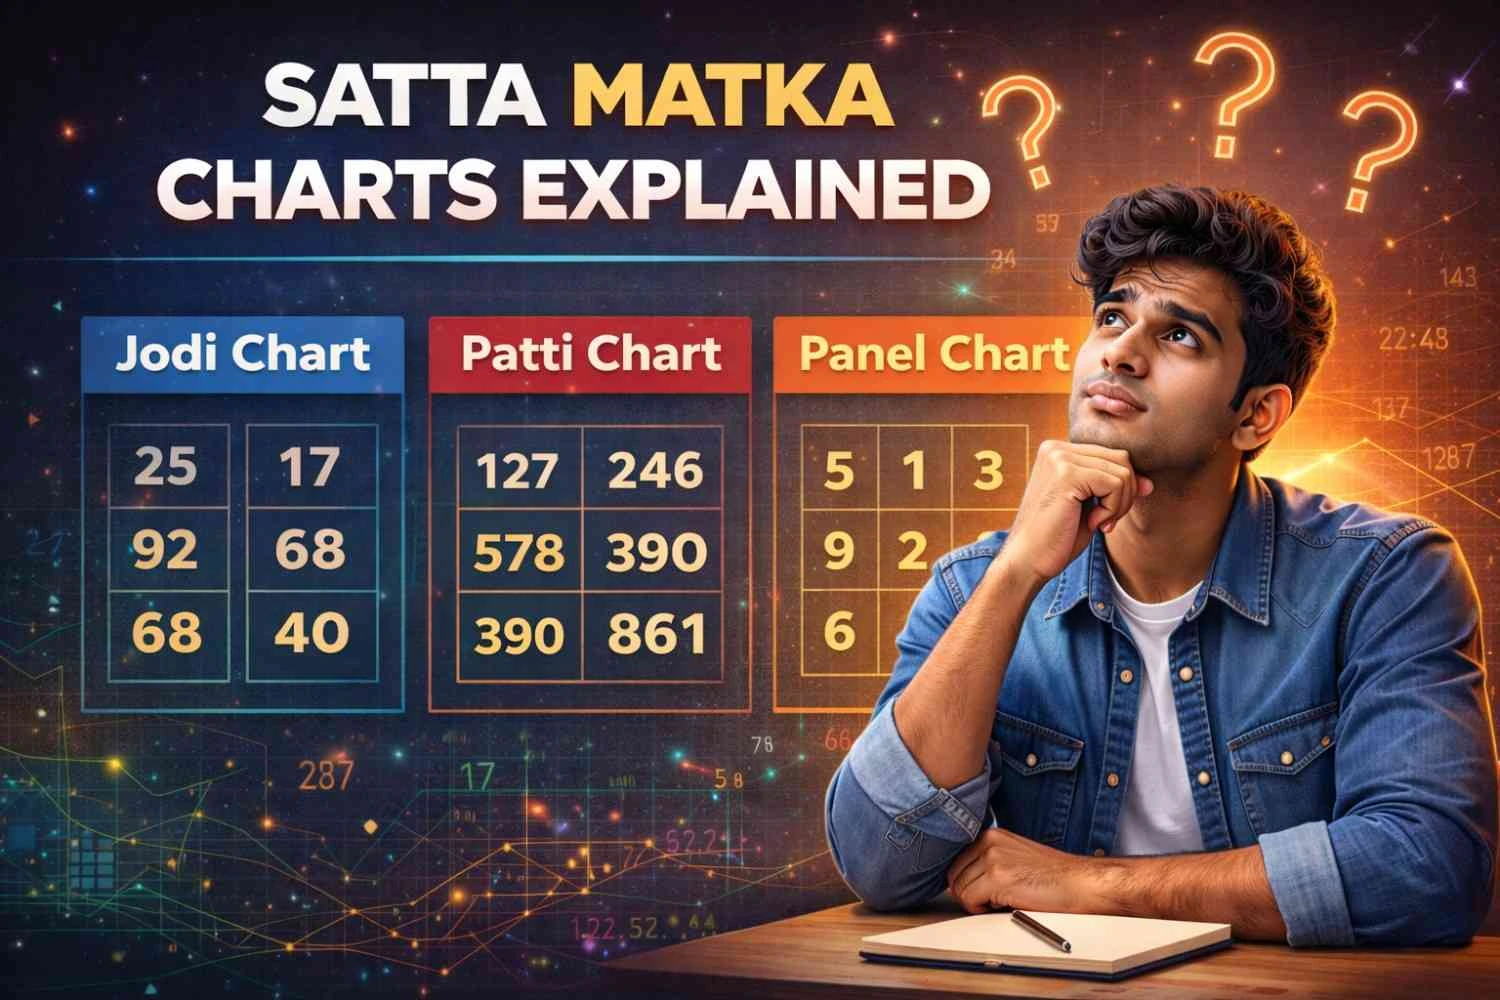
What Are Satta Matka Charts?
A Satta Matka chart is a table that shows historical market results including open, close, jodi and panel values. Each market has its own dedicated chart updated daily.
Understanding the Jodi Chart
The jodi chart displays two-digit numbers formed by combining the open and close values of a market. Jodi charts are commonly used to track how number pairs repeat or change across days.
What Is a Panel (Patti) Chart?
A panel chart (also known as patti chart) shows three-digit number combinations linked to a market. Panels provide deeper insight into number distribution and historical trends.
Why Charts Are Important for Analysis
- Helps users study historical result patterns
- Makes result tracking simple and organized
- Displays market-wise performance clearly
- Supports educational understanding of number formats
How Chart Layouts Are Organised
Most Satta Matka charts follow a date-wise grid format. Rows represent dates while columns display open, jodi and close values in structured order. This layout allows easy historical reference.
Difference Between Jodi and Panel Charts
Jodi charts focus on two-digit results, while panel charts display three-digit structures. Both are recorded daily but serve different reference purposes in historical chart archives.
Educational Guides vs Live Result Charts
This article explains chart structure for learning purposes. Live result pages display updated daily numbers. Understanding this difference helps users navigate the website without confusion between informational guides and real-time updates. You can view live markets on the Satta Matka results page.
Related Educational Articles
To understand system basics, read What is Satta Matka history and system explanation. For structured historical records, visit the historical Matka result charts.
To understand the complete system structure and market format, read our Complete Educational Guide which explains how markets are organised and how results are structured.
Written by FixResult Editorial Team – Structured educational content covering historical chart formats and system explanations.
For daily markets and chart updates visit the Satta Matka results homepage.
For a complete explanation of how historical records are organised, visit the Satta Matka chart guide.